In the last part of this lesson, we discovered that long-term average temperature data for a given location tends to have a sinusoidal pattern. In the next part of this lesson we will investigate the cyclic nature of the amount of daylight throughout the year, and compare the results to our temperature data.
To do this, we will collect data about the local times of sunrise and sunset , which may be found on a web page at the U. S. Naval Observatory. At this web site, you can enter any location in the world and any year, and the USNO will generate a table of sunrise and sunset times for that location and that year. Another option produces similar data for moonrise and moonset, but we are not concerned with that information right now.
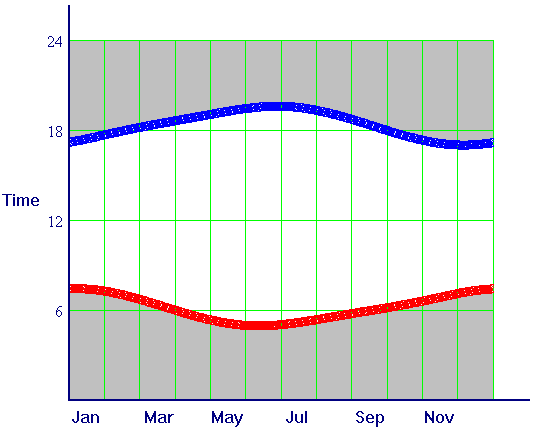
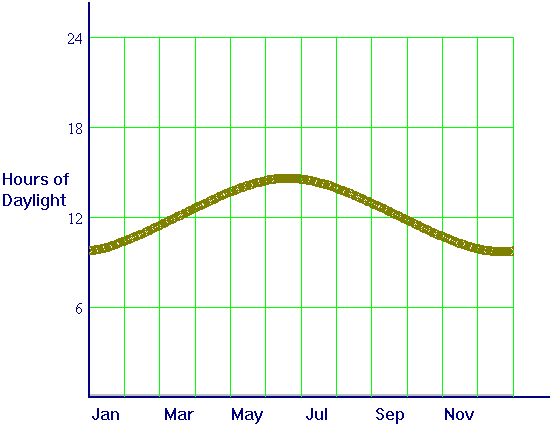
In the figure below, we can see a graph of the USNO data for sunrise and sunset for the 365 days of 1997 at Durham, NC. From this data, we can compute the hours of sunlight in Durham. We show the computed graph of daylight hours in the second figure below.

Now take a look at the
computed graph of daylight hours.

The following questions are observation and thought questions. They don't require any computation beyond visual estimates. (Computation comes in the next part.) We will refer to the two curves in the first figure as sunrise and sunset, and to the curve in the second figure as daylight.
How is the daylight
curve computed from the sunrise and sunset curves?
Which one(s) of the three
curves appear to be sinusoidal, that is, to have the shape of a
sine curve? For any that does not look sinusoidal, describe the way in
which it fails to be sinusoidal.
What days do you expect
to be the shortest and longest (in the sense of hours of daylight)? Are
these the days of earliest and latest sunrise and sunset? Explain.
Estimate the length of
the longest day. Of the shortest day.
Estimate the average
number of hours of daylight over the entire year.
Estimate the period
of
the daylight curve. In what way(s) would you expect a daylight curve
for 1998 or 2000 to differ from that for 1999?
|
|
|